

Tool Library
A working sample of what we build into institutional CRE stacks.
Demographics
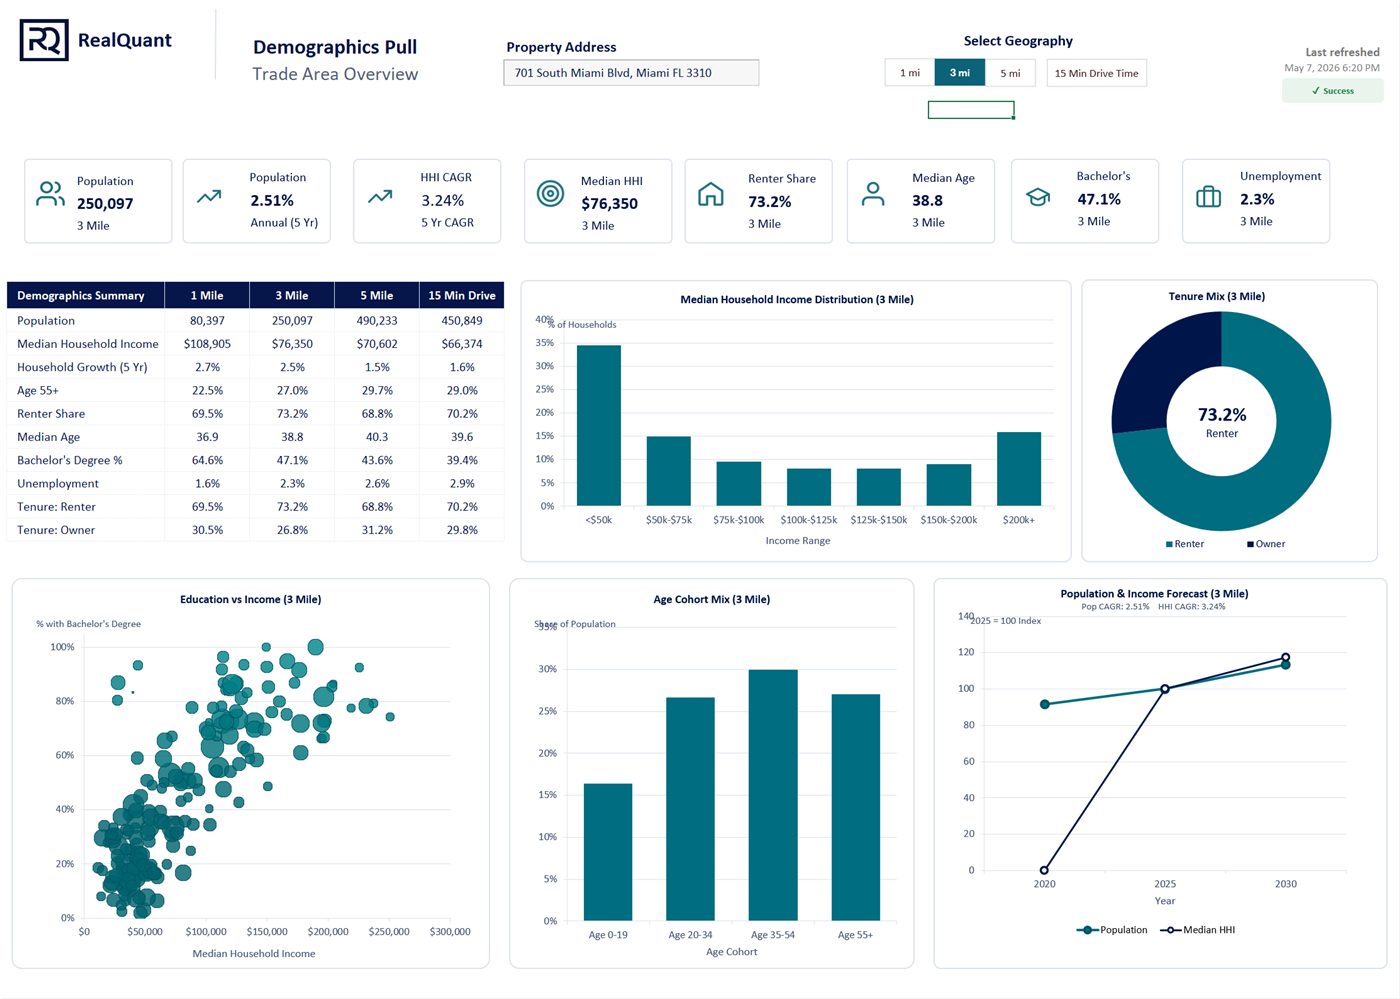
ESRI demographics directly in Excel
A macro-enabled Excel dashboard for trade-area demographics. Enter a property address, bring your own ESRI API key and free Census API key, and refresh radius or drive-time analytics directly in the workbook.
How it works
Enter your email to receive the secure workbook link
Create or copy your own ESRI API key and request a free Census API keyESRI docsCensus key
Unblock macros, paste both keys into Settings, enter an address, and refresh
Want this in your stack?
Customized, branded, and embedded alongside your team.
The Tool Library is a slice of what RealQuant Labs delivers: research tools, parsers, agents, and reporting infrastructure tailored to your asset class, integrated into your workflows, and maintained alongside your team.
See our services